Full Stack Marketing
October 31, 2017
analytics speakingFull Stack Marketing is the concept of building analytics into your tech stack. Why would you do that? Fundamentally we want to answer the question “Do you know what your users are doing?”. And more importantly - figure out how to get users to do what you want them to do. If we focus on measuring AARRR metrics, we can write code to optimize them. Our Analytics stack has four parts - Track, Measure, Test, and Report.

Track
Google Analytics (GA) tracking is pretty straightforward but can get complicated fast. You can do Analytics tracking on client and server side. Client-side tracking is the most prevalent and now uses gtag.js (formerly analytics.js). However, many ad blocking and/or privacy plugins will block this script from reporting. Therefore if you want bulletproof tracking you’ll need to use the server-side tracking implementing the Google Analytics Measurement Protocol.
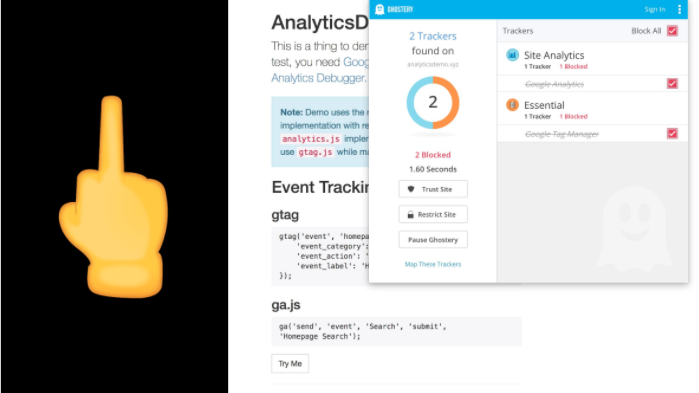
Basic tracking includes simple page view tracking - allowing you to see some engagement information about your users. Beyond the out-of-the-box functionality tracking pageviews, we can utilize Event Tracking, campaign tracking, conversion tracking, and remarketing among other custom functionality.
Javascript Example
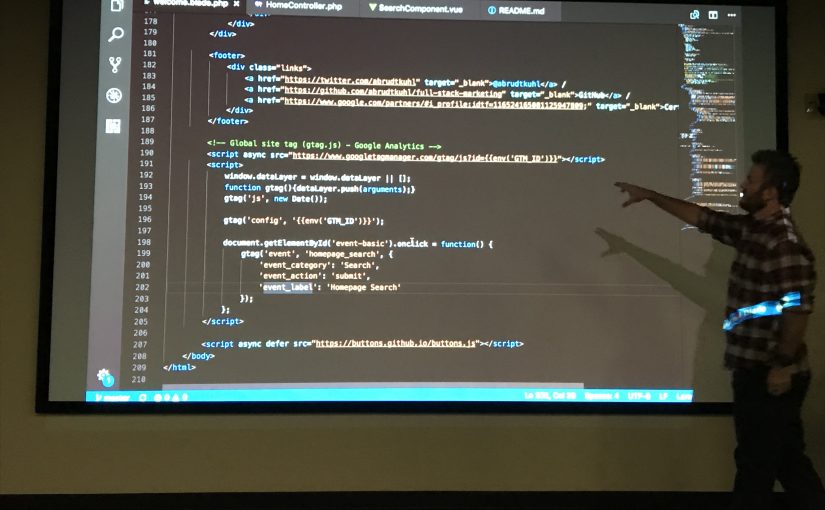
Here’s a very basic example of sending event tracking information to Google Analytics on a button click event. This seems innocent enough and can scale decently using CSS selectors to bind events to. However this can get unwieldy fast.

At some point you might end up where I did - with a server side tracking include that contained all kinds of conditional rules, tracking scripts, and very little documentation, versioning, or context. Enter Google Tag Manager.
Google Tag Manager
Google Tag Manager (GTM) is a tag management system to manage Javascript and HTML tags for tracking and analytics on websites. Now you can say goodbye to global-tracking.php or tracking.js where you dump a bunch of jQuery event handlers to manually track specific events in GA. GTM has the concept of tags and triggers. Tags are the definition of what you are tracking and triggering is what action occurs that will send that definition to GA. Triggers can be clicks, scrolls depth, page view duration, element visibility, and many other engagement events. GTM has many other interesting aspects to it beyond making it easy to define events and triggers for tracking. With GTM (and gtag.js now) you get access to the Data Layer which is essentially a Javascript array you can manipulate on the client side to do some clever tracking and data manipulation. Pro Tip: Google Tag Manager is very powerful. It’s my belief this should be owned by someone technical as it allows anyone to inject ANY HTML/Javascript into your website. This power can be abused and/or inadvertently error prone.
What To Track
This is a common question and there are infinite answers but the best is “it depends”. It depends on your site, audience, goals, conversions, etc. Here are some quick ideas.
- Video Views
- Button Clicks
- Dropdown Clicks
- Navigation Clicks
- Search Clicks
- Image Views
- Micro-conversions - add to cart, add to wishlist, fave, print, save
- Scrolling
Testing
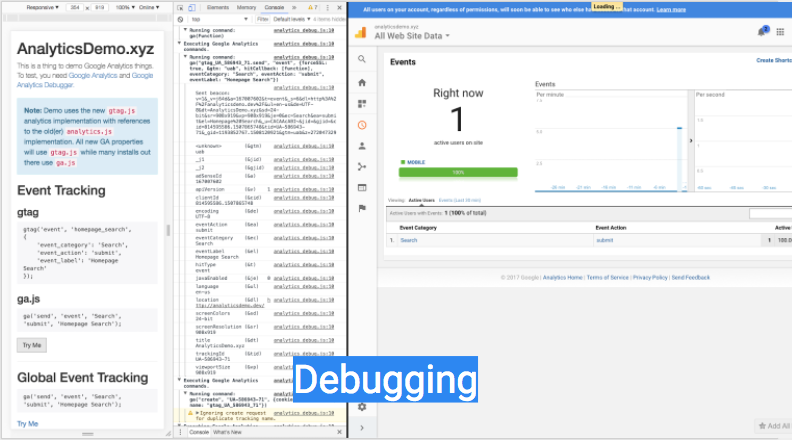
How do we know everything is working? You can use the Google Analytics Debugger Chrome extension to log all GA tracking events to your Dev Console. This is hugely valuable and a big time saver. You can also see client-side tracking in your GA realtime dashboard.
Google Tag Assistant is another Chrome extension you can add to your full stack analytics tool belt. Tag Assistant will help you troubleshot tags and test various implementation scenarios.
Pro Tip:
Setup a separate Google Analytics view for testing and debugging so you don’t skew your production analytics data.
Measure
You can track everything but measure nothing. This is the reason we are employing an Analytics stack. Tracking is just our fundamental base layer of data. Once we have data tracking we now need to make meaning of it. If you are tracking micro-conversions, you can measure the number over time to see if you are improving. You can measure which source yields the most amount of micro-conversions using attribution in your funnel. You can measure performance across devices. You can measure if people are consuming your content or if they are using desired functionality. The list of possibilities is endless, however you should focus on a few otherwise you will succumb to analysis paralysis.
Google Analytics Goals
GA is the tool of choice in this Analytics stack for measuring - specifically Goals. You can use goals to measure how often users complete specific actions.
Google Analytics Goal and Conversion tracking is the most under utilized feature in GA - but it’s super easy to setup. Most people just setup GA and let it run on the default settings, however 20-30 minutes of time can get you much further along.

Goals are essentially measurements of how users complete specific actions in your app or site. Common Goals include successful registration, finding and clicking on a search result, reading + scrolling through an entire page of content, or even just clicking on a button. You can measure the flow to goals through your apps in a visual funnel. You can attribute anything higher in your funnel to a goal - such as an acquisition channel? What does this mean in non-marketing speak? It means you can see if more people successfully registered on your site when they came from a PPC ad versus organic search. It means you can show that all the traffic to your site from Facebook is garbage. Measuring goals helps you create meaning to the endless swaths of data you are tracking.
What To Measure
- Number of events / conversions / micro-conversions over time
- Goals / Conversions
- App / Feature Usage
- API usage
- User engagement
Test
By now we are tracking events. We have goals setup. And we are measuring the completion of those goals. Now the fun is just beginning. We have all the tools in place to start experimenting. Testing in my world isn’t doing QA, it’s doing a/b tests. What variation of a page can yield the most goal completions? That leads us to the third tool in our Analytics stack - Google Optimize.
Google Optimize
Google Optimize (GO) is, among other things, a very well designed A/B testing suite for websites. GO is one of my favorite tools to implement rapid A/B testing. If you’ve ever written client or server side code to do feature toggling you will love using this. GO removes all the technical hurdles for testing variants of a website. It’s as simple as dropping in some JS (preferably via GTM) and setting up an experiment. A key factor of a successful A/B test is having data and KPI’s to measure against. If you’ve made it this far, you are ready to roll.
What To Test
Lets go back to the micro-conversions example and for the sake of an easy concept, visualize a recipe website. We are probably tracking page views, clicks on images, clicks on ingredients, and clicks on saving the recipe for later. Our micro-conversion is the user saving the recipe for later so we start measuring that. Cool, now what? Test variations of your website to see if any design or UX changes increase that number. You could test many things (multivariate test) or just two versions (split test). Again, to make it easy, imagine setting up an A/B split test to see if having a blue or red button yields more recipes saved by users.
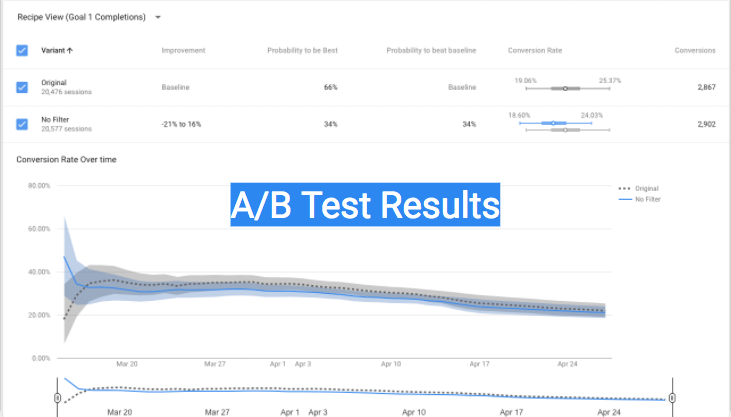
GO will let you know when you reach a big enough data set to reveal a statistically relevant conclusion. Now instead of guessing what button color to use, you’ve used data to make that decision for you. This concept can be extrapolated as you formulate a full digital strategy.
Report
We are tracking, measuring, and testing. Now what? Chances are someone wants (or at least should) your findings. Nobody likes creating reports. I’m not sure anybody even likes reading reports. But what’s the point of measuring and testing if you aren’t acting on the results? Reporting gives you the opportunity to create insights into how your app is being used as well as fuel more tests to prove new hypotheses. I’m going to show you two things. A reporting tool that doesn’t suck and a way to consume reports that doesn’t suck. Google Analytics has a pretty decent set of reporting tools. Google Analytics Realtime shows what’s happening right now on your site. We’ve seen this earlier when testing GA events. We put this up on a big tv in our office on full screen rotating through various dashboards. I don’t have to remember to always go look at reports - I see it whenever I go get coffee. You can also setup automated daily, weekly, monthly reporting customized to things important for you to track. But that just gets you started. The recommended tool for reporting in your Analytics stack is Google Data Studio (GDS).
Google Data Studio turns your data into informative dashboards and reports that are easy to read, easy to share, and fully customizable. Dashboarding allows you to tell great stories to support better business decisions.

GDS is a powerful Business Intelligence tool that you can use to create informative dashboards reporting on your digital tracking, measurement, and testing initiatives. With multiple datasources and some pre-built templates you can build out a nice dashboard suite in under an hour. You can hook up Search Console, Google Analytics, Google AdWords, and dozens of other sources. Furthermore you can build out blended reports with data from multiple sources.
What To Report
- Test Results / Recommendations
- Channel Attribution
- Conversion / Funnel Tracking
- User Engagement
Presentation
This presentation is accompanied by a demo site at https://analyticsdemo.xyz. There you can see client side event tracking in action with vanilla JS and Vue.js using the Google Analytics Debugger extension. Download the site on Github to see the code behind the demo. https://speakerdeck.com/abrudtkuhl/full-stack-marketing
Resources
Dev Libraries / APIs
- gtag.js
- analytics.js (legacy, aka ga.js)
- Google Analytics Measurement Protocol
Server Side
- Measurement Protocol Code Samples
- Validating Hits With Measurement Protocol
- Hit Builder - Construct and Validate Measurement Protocol Hits
- Tutorial: Tracking PDFs With Google Analytics Server Side